![]()
Furry con surveyed on porn, fantasy, pets, politics & bronies
 Results have been released from an Anthropomorphic Research Project survey of 455 furs taken at Furry Fiesta 2013.
- 78% of females and 96% of males report viewing furry porn. Both groups underestimated both figures by 8-12%.
- Increasing furriness indicated a tendency to use fantasy for various purposes, including escapism, but didn't indicate blurring of reality, or an inability to have fun, self-motivate, fulfil needs, socialize, or cope with problems without fantasy.
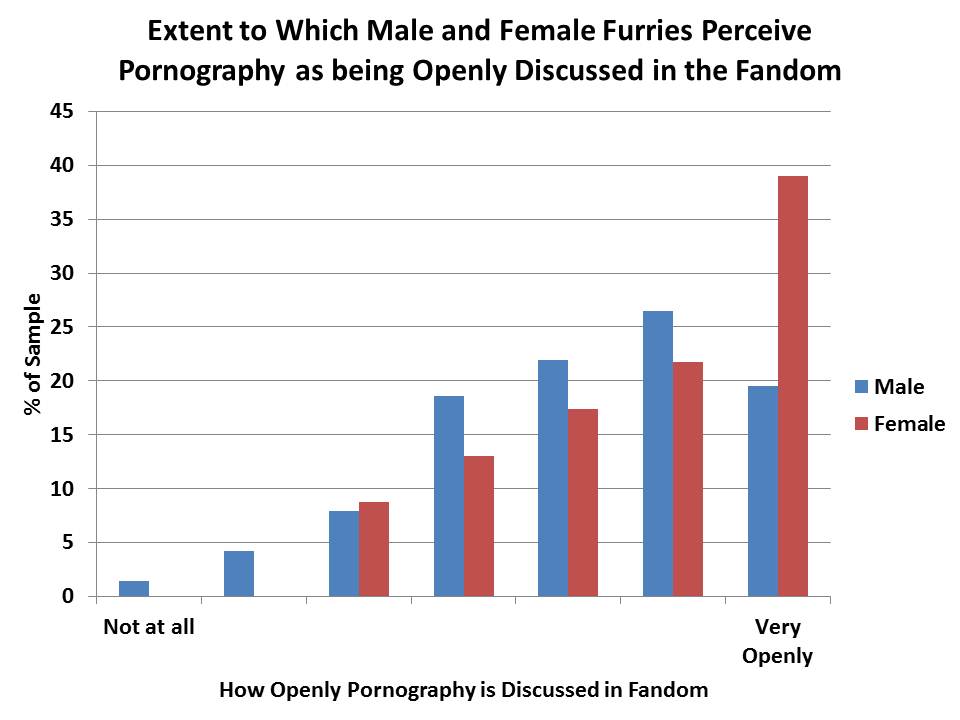
- Female furs had less sexual roleplay, owned less pornography, viewed it less frequently, and felt it had less influence on their joining the fandom. They also saw pornography as more openly discussed within the fandom.
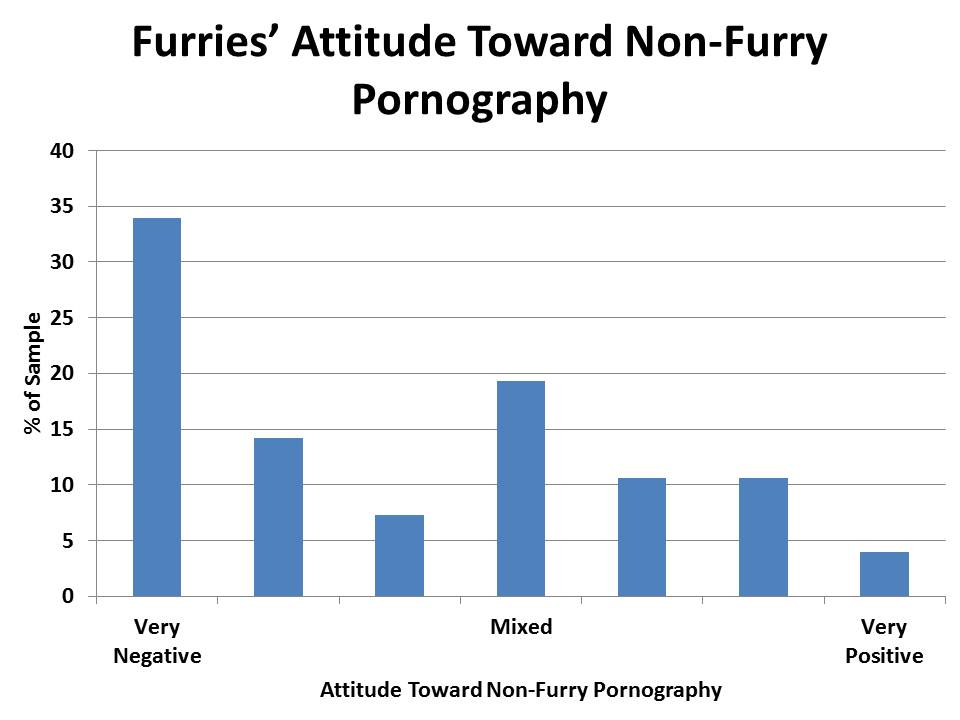
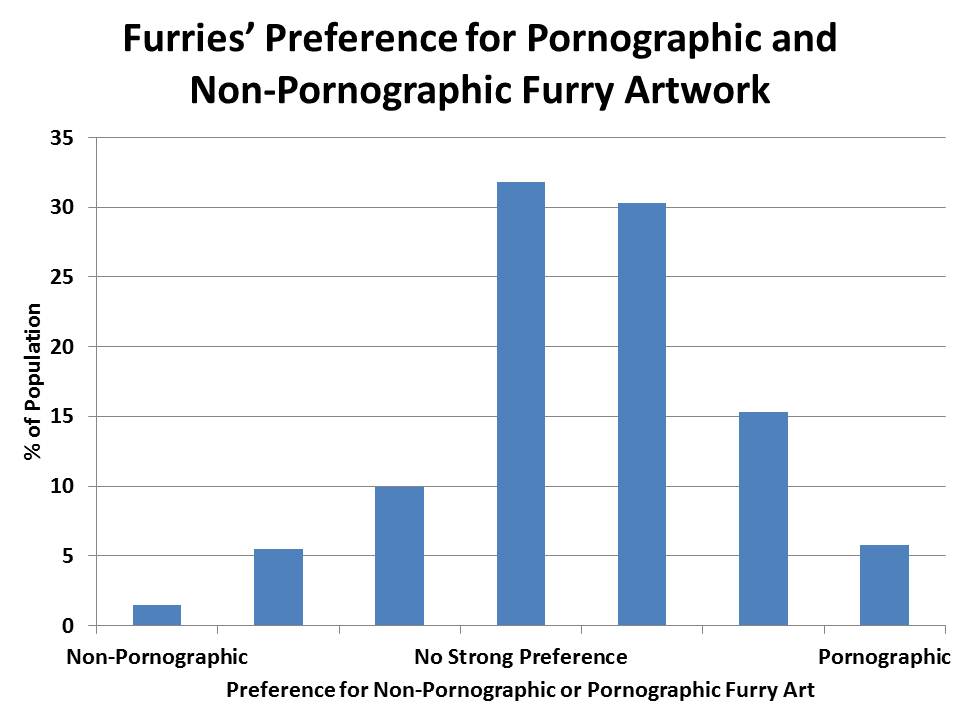
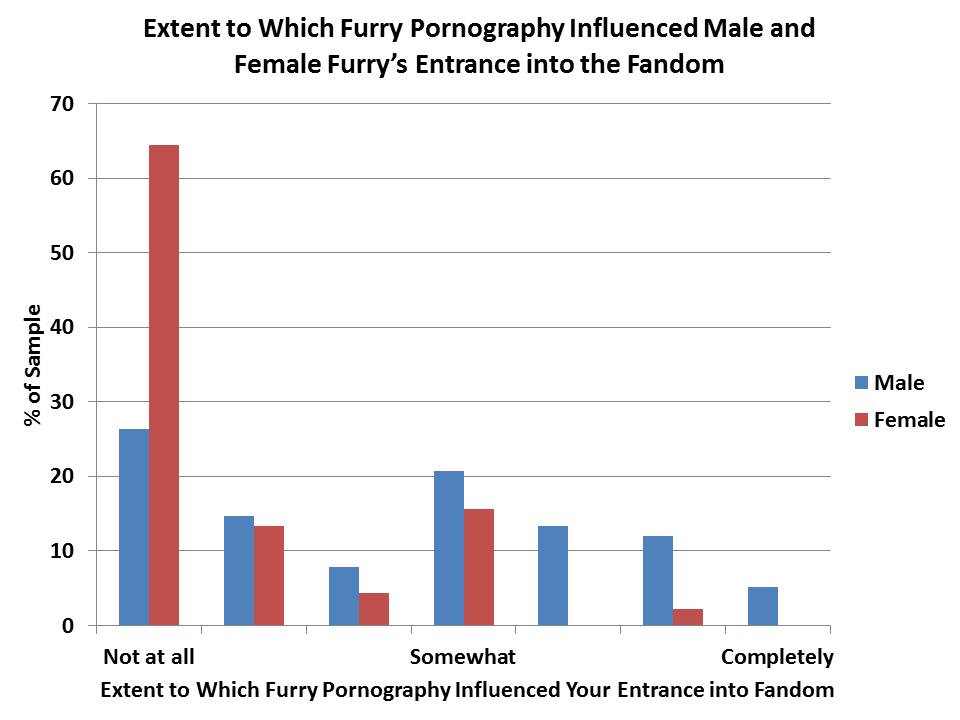
- Furries overestimated the positivity of both male and female furs towards furry porn: males tended to be positive or mixed, while over 20% of females had a negative view. 51% of furs preferred porn over general furry artwork; 17% had the opposite view. ~55% saw non-furry pornography in a negative light; some males only view furry porn.
- Non-brony furs rated bronies less positively (50) than furries (79) or non-furs (61).
- Furries are very liberal on social matters, but more moderate on economic topics.
- Therians anthropomorphise animals more than non-therian furs; those strongly identifying as furries gave human characteristics to both regular and stuffed animals.
Around half of those participating chose to join the group's three-year longitudinal study.
On [adjective][species]: JM revisits Dr. Gerbasi's original study – Nuka responds
Demographics, accommodation, relationships, and work/education 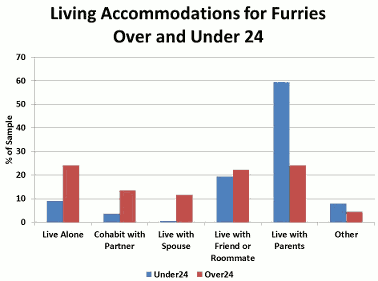

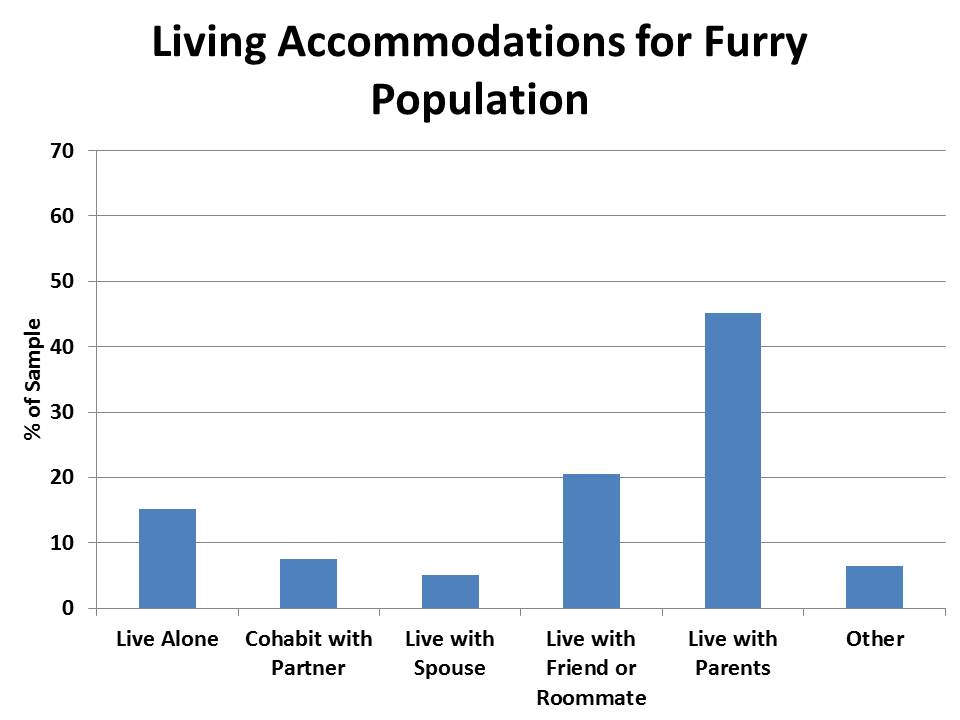
Gender accorded roughly with prior findings, at 77.9% male vs. 17.5% female, though some of the team's online surveys report slightly more males. Almost half of those surveyed lived with their parents – though this falls to around 25% for those 24 or above, who are more likely to live alone, or with a spouse or partner.
56% of the sample was single; 25.5% were dating, but only 5-6% were engaged, with a similar number married. Open, polyamorous, master/pet and "other" forms of relationships were each reported by ~6–7% of furs.
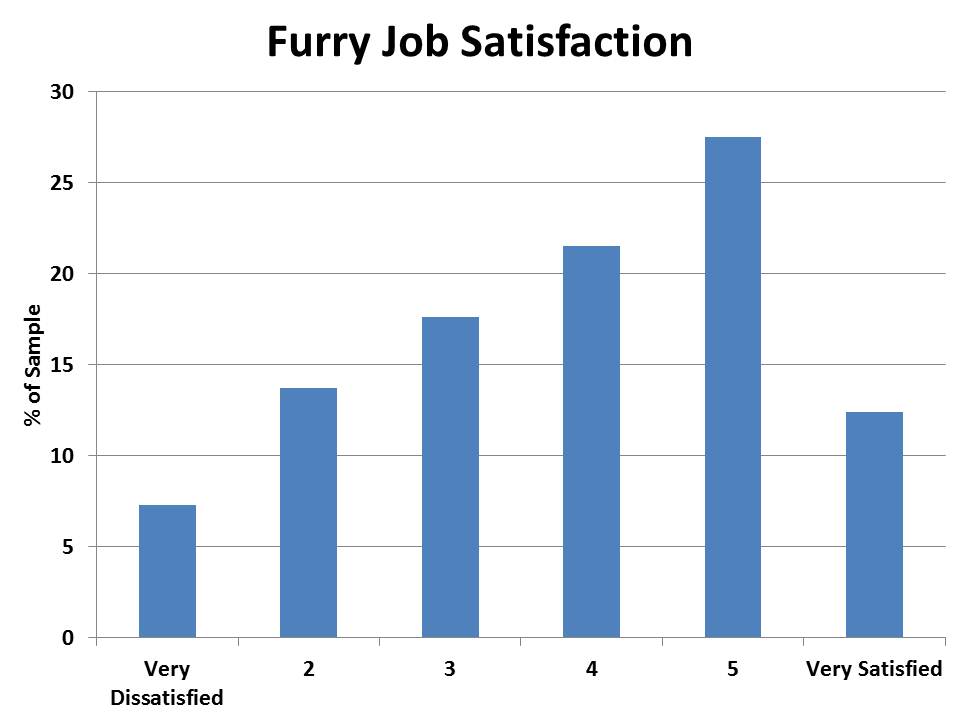
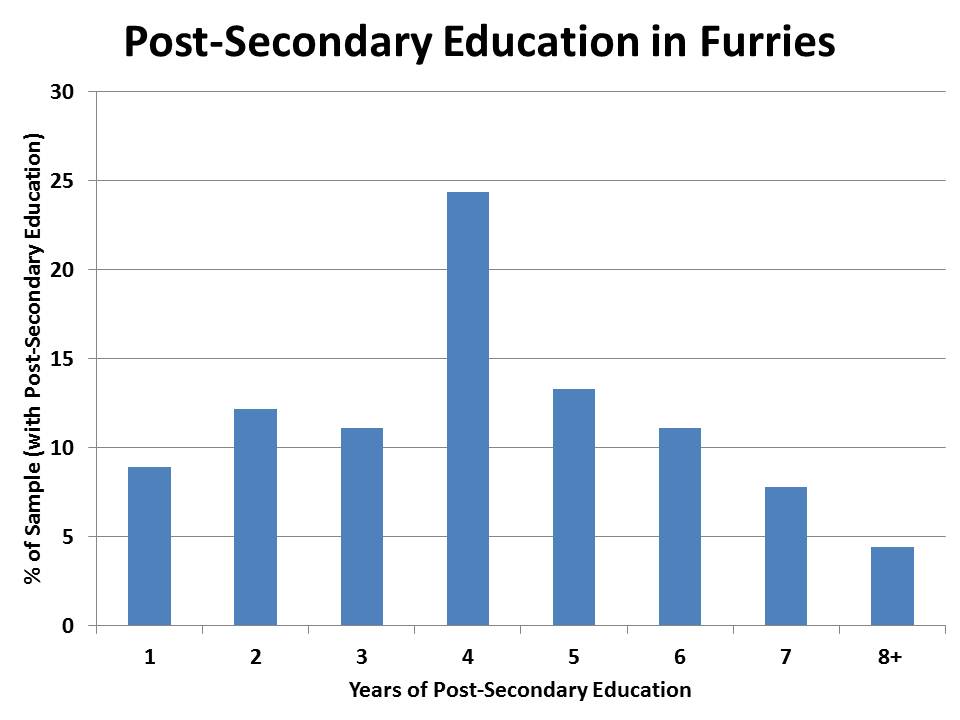
Nearly half attended full-time (35%) or part-time (11%) education; over half also had a full-time (32%) or part-time (24%) job, but nearly 30% reported unemployment; 23% were looking for work, and 9% chose "other" (e.g. homemakers). Intriguingly, over 4% indicated being disabled, while only 1% were retired. More furries were satisfied than dissatisfied with their current work status (~3.8–3.9 on a 1–6 scale). 25% of those with post-secondary education had four years of it. Future work may investigate whether those reporting less (or more) had faced trouble completing their courses, or were merely starting on it.
96% of the sample identified as furry, 17% as therian, 5% as otherkin, 5% as lycanthrope, 21% as brony, and 65% as human.
Therians were less likely to identify as human than non-therians (43.9% vs. 69.5%; t(77.2) = 3.56, p = .001).
Pornography in furry fandom: beliefs and reality
| Estimate: What % of male furries view furry porn? | Male guess: 83.7% Female guess: 84.0% |
| Estimate: What % of female furries view furry porn? | Male guess: 71.3% Female guess: 69.8% |
| "Do you view furry pornography?" | Males: 96.3% yes Females: 78.3% yes |
| "I view furry pornography exclusively/near-exclusively" | Males: 17.1% yes Females: 2.2% yes |
| "My pornography use is not exclusively furry" | Males: 41.0% yes Females: 77.7% yes |
Significant differences exist between male and female furs on the topic of furry pornography. Both groups underestimated the ratio of furries of both groups who viewed pornography, but overestimated their positivity towards pornography, as compared with their own attitudes. Researcher Courtney "Nuka" Plante called this "a near-perfect, textbook example of pluralistic ignorance in action: people assume that they're the only one who feels this way".
This effect was notable for female furries, who also perceived pornography to be more openly discussed within the fandom than males did (5.70 vs. 5.13; t(259) = 2.41, p = .017). The team suggested this resulted in a stereotype threat: females see furry fandom as overly-sexualized, and believe female furs are more positive about pornography than they actually are, leading to the feeling that they do not belong within the fandom — hence they don't join, or depart.
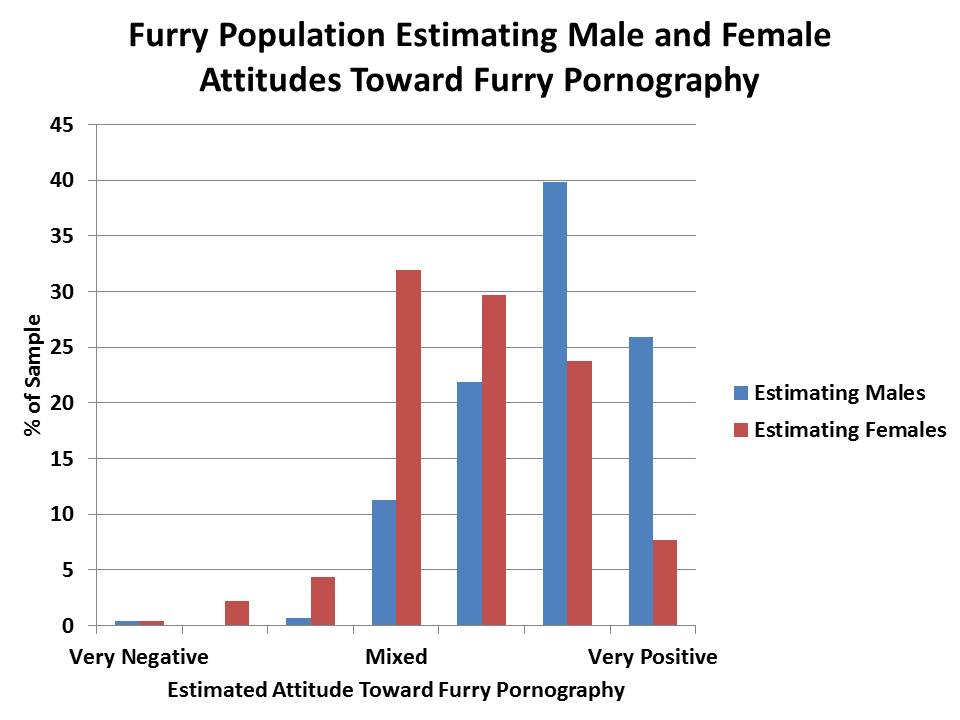

Both male and female furs were believed to be more positive about furry pornography than they actually were.
Male furs were more likely to view furry porn than female furs (t(49.0) = -2.87, p = .006). Males and females agreed on non-furry pornography:
More than a third of furries have relatively negative attitudes […] and only about a quarter of furries feel quite positively toward it.
There was no significant difference between the groups when asked if they preferred pornographic or non-pornographic furry artwork. Over 50% preferred pornographic furry art (vs. ~17% for non-pornographic), but both preferences were typically slight or middling (mean ~4.6).
| What % of furry art you view is pornographic? | Males: 50.9% Females: 30.7% |
| What % of furry art you own is pornographic? | Males: 20.9% Females: 8.7% |
| Times pornography viewed in the last month | Males: 43.5 Females: 10.5 |
| What % of online roleplay is in a sexual context? | Males: 34.0% Females: 21.4% |
Male furs were more positive about using furry pornography than females (4.82 vs. 3.19 on a 1–7 point scale, t(242) = 4.97, p < .001); almost a fifth reported using it exclusively. While males were "MUCH more likely to report that their interest in the fandom was influenced by furry pornography" (3.36 vs. 1.80, t(90.2) = 6.73, p < .001), half the furs surveyed said it "had little to no influence".
Fantasy engagement
Researchers knew that fantasy is significantly related to the level of furry identification.
But what do furries use it for?
The more 'furry' a person was, the more they tended to used fantasy:
- to express some part of themselves (B = .32, p < .001)
- as a means of motivating themselves (B = .23, p < .001)
- for recreational purposes (B = .22, p < .001)
- to fulfill some currently unfulfilled need in their life (B = .19, p = .001)
- as means of coping with setbacks and failures (B = .17, p = .006)
- as a means of escapism from the real world (B = .17, p = .005)
Being [more] furry did NOT significantly predict the use of fantasy for social reasons [IM, chat, etc.] (B = .10, p = .098)
More dedicated furries were more likely to use fantasy as their only means of self-expression (B = .14, p = .018) and escapism (B = .19, p = .002). However, they were not more likely to use fantasy as the only way to "have fun, fulfill needs, engage in social interaction, motivate oneself, or cope with problems", nor did it predict a "blurring of fantasy or reality" (B = .07, p = .46) or "problematic fantasy use" (B = -.04, p = .64).
Bronies in the fandom
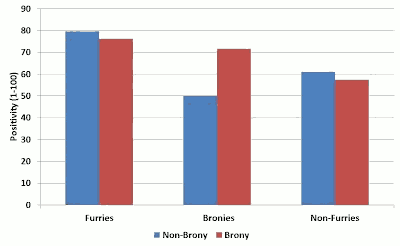 ARP researchers had covered bronies in the furry fandom, but they wanted to learn more about how the groups felt about each other. While both brony and non-brony furs rated furries higher than non-furs (the difference in their ratings of non-furs was insignificant), non-brony furries rated bronies far less positively than they rated non-furs (50 vs. 61 on a 100-point scale; t(238) = -5.60, p < .001).
Compared to non-brony furs, the furry bronies:
- had a far higher opinion of bronies (72 vs. 50; t(63) = 3.97, p < .001)
- thought other bronies would be more positive about non-furs
(58.6 vs. 52.0; t(304) = -2.62, p =.009), and - thought non-furs would rate bronies more positively (33.1 vs. 24.9; t(301) = -3.65, p < .001)
The team said these findings represented "positive biases in the way we view the groups to which we belong", and that:
[The negative rating of bronies vs. non-furs] provides evidence to support the claim that non-brony furries may feel particular malice for bronies because they are, at some level, somewhat comparable to the furry fandom.
This survey did not cover non-furry bronies, and may not be representative of bronies in general. For a view from the brony side, see this survey.
Politics, pets, and bonus anthropomorphism findings
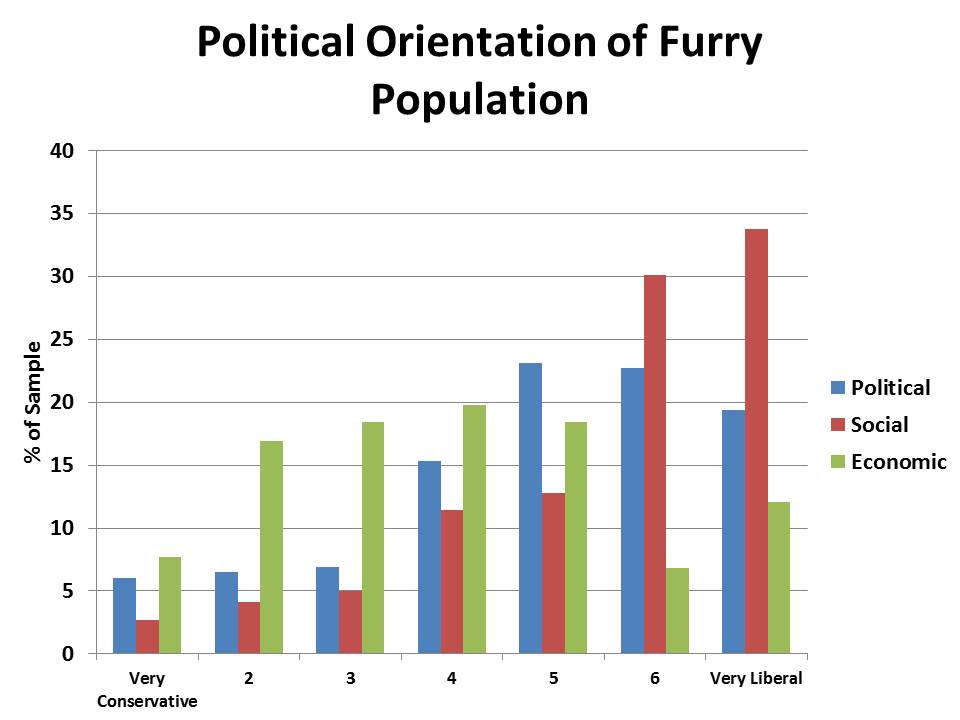 On a conservative/liberal scale, those surveyed "define themselves as quite socially liberal" (mean 6.03 on a 1 to 7 scale), but "reported a much more moderate position" economically (mean 4.93; F(1,273) = 96.12, p < .001). Researchers suggested that respondents' choice on a political scale (mean 5.56) was a composite of their social ("same-sex marriage, immigration, religious issues, abortion") and economic ("privatized health care, military spending, and welfare/social security") positions.
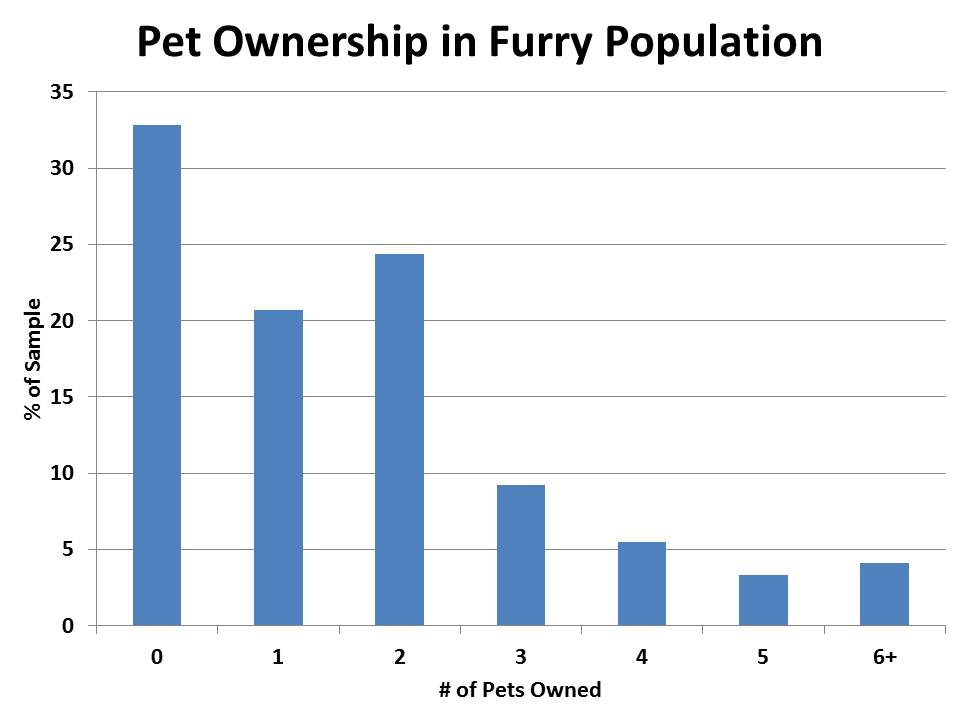
While the team had previously asked whether furries had owned a pet (most had), this time they asked how many were currently owned:
Nearly one-third of furries reported that they did not currently own a pet, while nearly half of furries said that they owned one or two pets.
The team hypothesized that those who wished to own a pet (and had in the past) might not be able to due to their current living arrangements.
In email, Nuka revealed findings relating to the anthropomorphism of animals (as compared to objects such as robots, cars and computers):
- Those identifying more strongly as furries tend to anthropomorphise animals more (B = .29, p < .001)
- …but not as much as those identifying as therians (t(79.1) = -3.24, p = .002)
- Those identifying as furries do not anthropmorphise all objects more than usual (B = .09, p = .33),
- …but do tend to anthropmorphise stuffed animals (B = .12, p = .048)
Lists of things to do with bricks and common features of chairs and tables were also collected, in a bid to measure furry creativity.
Figures provided by the Anthropomorphic Research Project; see their survey results page and Flayrah's past survey coverage for more details.

About the author
GreenReaper (Laurence Parry) — read stories — contact (login required)a developer, editor and Kai Norn from London, United Kingdom, interested in wikis and computers
Small fuzzy creature who likes cheese & carrots. Founder of WikiFur, lead admin of Inkbunny, and Editor-in-Chief of Flayrah.
Comments
"Almost half of those surveyed lived with their parents – though this falls to around 25% for those 24 or above, who are more likely to live alone, or with a spouse or partner."
Think you meant friend or roommate here Green (that bar's bigger then spouse or partner).
Not to sound like an idiot, but I think I need more explanation as to what things like (t(79.1) = -3.24, p = .002) mean. I'm not a sociologist, I just pretend to be one on the internet.
The meaning is that those 24 or older are more likely to live alone or with a spouse or partner than those under 24. It's also true that in both cases, more live with a friend or roommate; however, this does not differ that much with age and was not what I or Nuka was getting at:
The t-test is used to determine if two sets are significantly different from each other. As I understand it, you're comparing the means and seeing whether the difference is significant. The significance level is given by the p-value ; "p < 0.001" would mean there is less than a 0.1% chance that the null hypothesis is correct (and so a more than 99.9% chance that the values are different). A lower p means a stronger conclusion, while the absolute value after the = indicates the magnitude of the difference between the two means.
Anything with "B" in it is a regression analysis, where you're saying "does X depend on Y?" The B-value is how strong the correlation is. So, the data indicates a stronger correlation between "furriness" and the use of fantasy for self expression purposes than between "furriness" and fantasy's use for recreation – but in both cases the chance for the relation to be true was measured at more than 99.9%.
Ah okay, when compared to the youngers yes, I get ya. I was just looking at the data for olders alone.
Pet peeve alert:
I wish the world was this simple. It's an unfortunate fact that p-values cannot be simply related to the probabilities of a hypothesis being true or false: see Wikipedia. Lindley's paradox shows a situation where the null hypothesis typically is rejected, even though it has a high posterior probability of being true.
In real-world applications, the "true probabilities" of interest cannot ever be found. Statisticians then like to use p-values as proxies, since they can be computed unambiguously, but they have quite a few limitations.
In general, the p-value quantifies how probable it would be for results that are "at least as extreme" as those observed in the survey to occur by chance alone, assuming that the null hypothesis is true. This null hypothesis typically contains a lot of strong, tacit assumptions, which may not be satisfied in practice; for instance, the t-test generally assumes that deviations follow a normal distribution. If the actual distribution has high kurtosis, extreme deviations become more common. A t-test would then be misleading, as it often would give small p-values, even if the two means being compared are the same.
Regression analysis, as in the second quote, is even hairier (furrier?), in that standard correlation measures generally assume a linear relationship between the two values, on top of any distribution assumptions. Even if there is a relationship between the quantities being studied, it need not be linear at all. It could, in fact, be very complex and nonlinear. For instance, a "positive correlation" between x and y—in the sense that y on average seems to increase with x for the data at hand—could reverse itself, and the expected value of y might start decreasing for large x-values. Anscombe's quartet is a good example here.
I agree entirely with Staghorne here =) Statistics are always to be taken with a grain of salt; I include them in the data not because I'm trying to say "therefore these are undisputed conclusions", but rather, in the interest of transparency and "showing my work". Were I to just make a whole bunch of claims about "what the data showed", I would be subject to immense criticism (for good reason): who am I to decide what counts as "significant" or not? At least using t-tests and regression analyses, I can say "well, according tho this procedure, it is statistically significant".
As Staghorne mentioned, this is certainly not a perfect process: t-tests and regression analyses are riddled with all kinds of assumptions about the distribution of the data. I run with those analyses primarily because they're the ones most frequently used by social psychologists. I'm also partial to structural equation modeling which, while again not perfect, has the advantage of being a bit more accurate in taking into account the simultaneous relationship of multiple predictor variables, multiple outcome variables, shared covariance, etc...
Staghorne also misses an important point about interpretation of statistics: there is a world of difference between statistically significant and practically significant; it's a bit less of a big deal in this case, given that our sample size is not utterly ridiculously huge; but in sample sizes of, say, 5,000, just because two means are statistically significantly different does not mean that it's practical to call them "different": in sample sizes that large you could end up talking about utterly minuscule effect sizes!
I would say that I agree, in general, with your comments Staghorne, but in the interests of being positive and pragmatic, I'll mention that it's easy to point out all of the reasons why something is bad, but something else entirely to posit a better system. In place of these statistics, can you think of a better way to present / analyze the data (in a manner that's both reasonably simple for people to interpret and in a space-friendly manner?) The problems you're describing are indeed problems that have long existed with inferential statistics. But until I'm able to survey the entirety of the furry population, they're the best we can do =P
Thank you for responding, Nuka! I agree with everything you're saying. :)
Thank you for pointing this out! I'm so used to this by now that I don't find the distinction between statistically and practically significant paradoxical anymore, but it is indeed important to keep in mind.
Actually, I think the fact that statistics can pinpoint such minute effects is a testament to the power of the approach. In a practical situation, however, this specificity is often blunted by incorrect assumptions and various inescapable biases. It's a bit sad that all these beautiful numbers we can compute are so sensitive to factors we cannot treat or control with math alone... :/
Oops! I didn't mean to come off as negative; apologies all around.
Furthermore, it was not at all my intention to imply that significance testing is a bad idea. On the contrary, I agree with all your points here—not to mention that I think the research is super-interesting and that I loved reading about it here on Flayrah.
Personally, I think significance testing is one of the best tools in statistics, and I love seeing it used in research (yours very much included), as long as one is aware of the limitations. The distinction between p-values and hypothesis probabilities, in particular, is one of those things I think are beneficial to know, in order to discuss quantitative scientific results effectively; hence my original comment.
Addendum:
For an entertaining (though not necessarily easy-to-read) thought experiment showing how poorly p-values in published research may connect with actual effects, I can recommend this blog entry by Cosma Shalizi.
*laughs* Sorry about that; for the most part, those can be ignored. That's my attempt to "show my work", and represents a compromise between furs who say "just give me the findings in plain language" and those who say "you can't just make claims like that... show us your statistics!" I feared that starting off the article explaining the rationale of t-tests and regression analyses would intimidate furries who just peeked in to read a short summary of what we learned (and who want to read something in plain English).
Greenreaper did a pretty good job explaining it =) Basically, if the p-value is "less than .05", it suggests that:
a) if it's a t-test, a difference between means of that magnitude would only be expected to be due to random error less than 5% of the time.
b) if it's a regression analyses, a linear relationship of that magnitude between two variables would only be expected to occur less than 5% of the time.
All of this needs to be taken with a grain of salt, of course. Statistics are based on assumptions and are inferences about reality based on a limited sample (Staghorne does a good job describing some of these concerns). That said, this IS how the vast majority of social science (and "hard science", for that matter) is analyzed!
I know I should have said something pertaining to the actual survey, or a social commentary.
But all I can say is... bronIES. It is spelled "b-r-o-n-i-e-s".
Well, I'll be...
Technically that's another thing furries and bronies have in common. According to English rules the 'y' should be changed to an I, but I've seen furrys and bronys spelled the other way alot too.
Yeah, that made me twitch, too! I've cut out the title, at least; it isn't necessary when it's right next to what it illustrates.
Edit: I transplanted the "ies" from "furries" - problem solved!
*laughs* Yup; I continually go back and forth on this one, because I'm not entirely sure what the proper convention is. I know, grammatically, that "bronies" is the way it OUGHT to be spelled. I also know, however, that English is a language riddled with all kinds of exceptions, especially when it comes to proper nouns, and I have seen it spelled both "bronys" and "bronies" by the brony community.
Also, when you're putting together this write-up in your spare time between writing academic papers, teaching, and taking classes, mistakes happen =P
Nice departure away from the reviews. Some interesting stuff there too. One question about the stats though. While I'm familiar with p-values I'm not sure what the B and t values mean, can you explain those?
EDIT: Okay, I see you answered that in the other comment. Although while I get their showing different tests, what do the actual numbers there represent? Is it some sort of scale or what?
"If all mankind minus one, were of one opinion, and only one person were of the contrary opinion, mankind would be no more justified in silencing that one person, than he, if he had the power, would be justified in silencing mankind."
~John Stuart Mill~
The B-values represent standardized regression coefficients. Here's the rationale for them, put very simply:
- A t-test is great for answering the question "are two groups different" (e.g. "furries" vs. "non-furries"
- The problem is, in this study, we didn't have any "non-furries"
- So we did the next best thing: we used a continuous variable of "furriness": we asked participants to indicate how important furry was as a part of their identity on a 7-point scale. We used THIS as a proxy for "furry/non-furry"
- Now, we can't do a standard t-test on this data, because we don't have 2 different groups: there's all the people who said "1", plus those who said "2", plus those who said "3"... all the way to those who said "7". And it doesn't really make a lot of sense to treat them as 7 separate, completely independent groups: there IS a linear gradient (people who said "1" are a lot like people who said "2", and people who said "4" are probably more like people who said "5" than people who said "1" are.
- A linear regression basically plots the "line of best fit" for the data, and indicates what the slope of that line is (that's essentially what "B" is: the slope of that line). If it's positive, it means there's a positive relationship between "X" and "Y"; if it's negative, there's a negative relationship between "X" and "Y". The p-value afterward tells us if, statistically speaking, there's enough evidence to suggest that this slope is significantly different from "0" (which would mean "there is no relationship between X and Y"). If it's p<.05, then we say "yup, this relationship seems to be significant, because we wouldn't expect a slope that big to be due to simply to chance alone".
In sum, the B-value tells you the magnitude of the relationship between the two variables (and whether it's positive or negative), as imagined by the slope of a line that fits the data plot.
As for t-tests, a higher t-value tells you that the difference between the two groups is larger; it doesn't easily translate into something "practical"... Though, as a general rule of thumb, if the t-value is greater than about 2 (or smaller than -2), you can start to feel confident that the two groups are significantly different.
Now, with the technicalities out of the way, I guess I'll get the ball rolling on questions:
Well, I don't know about 79% of readers and their reaction to pony stories, but I'm not gonna stop submitting them, so they can suck my dick.
You know what, I should probably stop commenting again.
Cross man, you seem a bit more irate then usual.
Actually, my computer's been down for a month and then the two months before that I rage quit commenting, so I think you're just remembering me through rose-colored glasses.
I spend a fair amount of time rping as a female growlithe. One reason was I don't really like being on top and one guy kept wanting that so I changed to female form so then he couldn't make me go on top. :)
"If all mankind minus one, were of one opinion, and only one person were of the contrary opinion, mankind would be no more justified in silencing that one person, than he, if he had the power, would be justified in silencing mankind."
~John Stuart Mill~
wtf people with vaginas can totally top
That’s what I said.
Good that he can do that transforming into a female thing, though. Otherwise, we might’ve had a problem.
Fair enough. I suppose penetrate would've worked better.
"If all mankind minus one, were of one opinion, and only one person were of the contrary opinion, mankind would be no more justified in silencing that one person, than he, if he had the power, would be justified in silencing mankind."
~John Stuart Mill~
I hope that you don't date women in real life because I'd feel more than a bit sad for them, haha.
Well if you believe this study that means furry males are actually less likely to view porn than non-furry males... because a Montreal study had found once that non-porn viewing males don't exist: http://www.telegraph.co.uk/women/sex/6709646/All-men-watch-porn-scientists-find....
Either that or 4% of furry males are liars
Perhaps within the margin of error, on both sides?
Post new comment